View API usage analytics
Overview
This page describes how you can analyze your use of Sky Mavis APIs effectively.
Leveraging detailed usage metrics generated by Sky Mavis APIs, you can achieve several key objectives:
- Gain insights into your app's interaction with Sky Mavis APIs.
- Evaluate the performance of both your app and the Sky Mavis APIs it uses.
- Identify and troubleshoot issues in the integration with Sky Mavis APIs.
Sky Mavis APIs provide essential metrics that serve as indicators of service health. These include data on the number of requests, the frequency of errors, the speed of responses, and overall request volume.
Monitor your API usage
- Go to the Developer Console.
- Select the Request Analytics page.
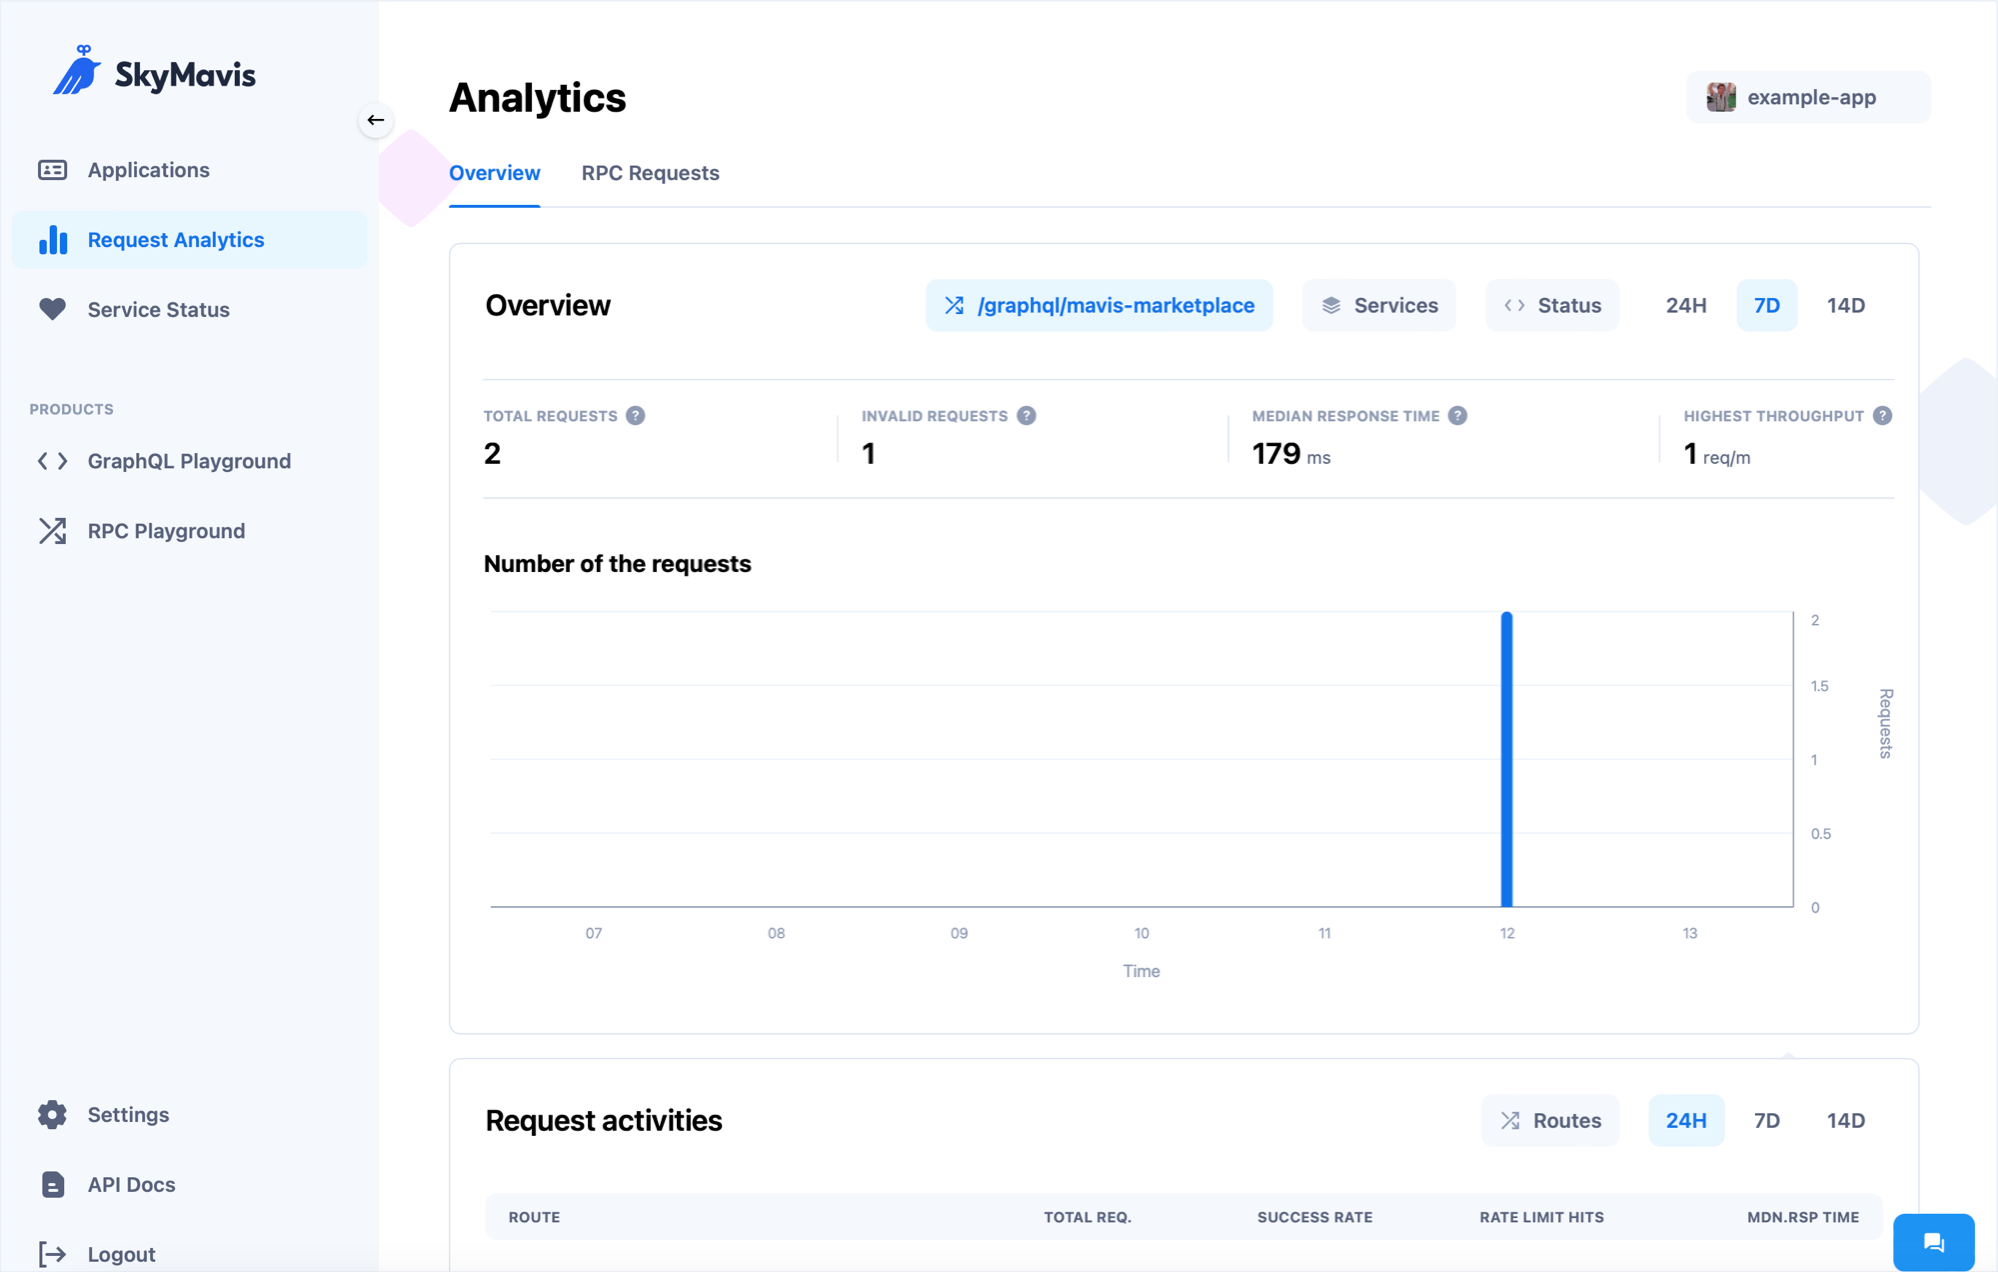
The Overview tab presents a comprehensive summary of your API activity, including metrics such as the total number of requests made by your application, the count of requests that encountered errors, the median response time, and peak request volume. Additionally, the Overview section offers:
- Overview: This includes a snapshot of your app's total requests, error occurrences, median response time, and maximum request volume within a given timeframe.
- Request activities: Visual charts detail your total request count, success rate, instances of hitting rate limits, and average response times.
- Recent responses: A log of the 10 most recent responses to help you monitor the latest interactions.
For a deeper dive into specific API interactions, the RPC Requests tab zeroes in on the usage statistics related to RPC methods.
To explore these metrics in depth, navigate to the Request Analytics page. If you're interested in analyzing the data for a particular service or API route, use the Services or Routes options, respectively.
Selecting a service or route, such as /graphql/mavis-marketplace, provides a focused view of the usage statistics for that particular endpoint.
It's important to note that selecting a service or route is an independent action, allowing for flexible analysis of your API interactions.